On February 28, 2026, the United States and Israel launched coordinated strikes against Iran. Within four weeks, Brent crude breached $100 for the first time since August 2022, the Strait of Hormuz was effectively closed to commercial shipping, four central banks froze rate decisions in a single week, and governments across Asia began rationing fuel. This page is a living reference document tracking how the conflict has reshaped global markets, commodity flows, monetary policy, and food security since the first missile landed.
Week One: February 28 to March 6. The Opening Shock
President Donald Trump declared major combat operations on the morning of February 28. US and Israeli forces struck Iranian military installations, nuclear facilities, and air defence systems in what the Pentagon described as the largest joint operation since the 2003 invasion of Iraq. Iran retaliated within hours, launching ballistic missiles and Shahed drones against US military positions in Bahrain, Kuwait, and across the Gulf.
Oil markets gapped open on Monday, March 3, with Brent surging toward $73 before accelerating through the week. By Friday, Brent posted its biggest weekly gain since Russia invaded Ukraine. Gold touched $5,400 in safe-haven buying before reversing as traders priced in the inflationary implications of sustained conflict. The dollar index surged as every energy-importing currency sold off simultaneously.
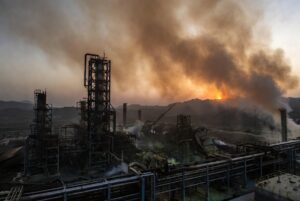
Iran’s IRGC issued warnings prohibiting vessel passage through the Strait of Hormuz. By day four, major insurers had pulled war risk coverage for tankers in the strait. Shipping traffic fell by more than 70 percent within 48 hours. Eight countries closed their airspace. A Shahed drone struck the largest refinery in the Middle East. The market scrambled to reprice a world where 20 percent of global seaborne oil was no longer moving.
South Korea’s Kospi crashed in its worst session on record as margin calls cascaded through leveraged positions. The exchange briefly suspended trading after Kospi 200 futures fell more than 5 percent. Bitcoin fell toward $65,000 as the crypto market moved in lockstep with risk assets. Six wallets on Polymarket made $1 million on the strike before the first missile landed, raising questions about whether prediction markets had been used for insider trading on classified military intelligence.
Russia began feeding Iran intelligence on American troop positions, adding a third player to a conflict that had been framed as bilateral. The Department of Justice opened an investigation into Binance over Iran-related transactions, and Iran’s biggest crypto exchange became a war zone exit door as citizens scrambled to move capital offshore through the only financial infrastructure still operating under sanctions and bombardment. US nonfarm payrolls for February printed minus 92,000, confirming the labour market was already weakening before the war’s economic effects had landed.
Week Two: March 7 to March 13. The Supply Shock Materialises
Iran’s retaliatory strikes expanded beyond military targets. Iran knocked out 17 percent of Qatar’s LNG capacity with drone strikes on Ras Laffan, the world’s largest LNG processing hub. Repairs were estimated to take up to five years. A fifth of global LNG was taken offline and the United States did not have the export capacity to fill the gap. European TTF natural gas futures topped 65 euros per megawatt-hour, more than 50 percent above pre-conflict levels. A Russian gas tanker sank in the Mediterranean, removing Europe’s last backup plan alongside the Hormuz closure. The continent that had spent three years weaning itself off Russian gas found itself without either supply source simultaneously.
Brent closed above $100 for the first time since August 2022. The IEA responded with the largest coordinated release of strategic reserves in its history, 400 million barrels from 32 member countries. The market did not care. Brent continued rising because the release addressed inventory, not flow. Gulf producers had lost 6.7 million barrels per day of production capacity. Four hundred million barrels at that consumption rate provides roughly 60 days of cover, and the war was already burning through it faster than anyone expected.
Oil touched $120 and crashed to $86 in the same session as a false ceasefire rumour swept through markets before being denied by Tehran. The intraday range was the widest since 2008. The paper market and physical market diverged, with spot premiums for delivered crude exceeding futures prices by margins not seen in decades.
Samsung and SK Hynix reported a helium problem that received almost no coverage in financial media. Qatar supplies roughly 30 percent of the world’s helium, an irreplaceable input for semiconductor fabrication. With Ras Laffan offline, chip fabs across Asia faced two to four weeks of inventory before production would be forced to slow. The war was reaching supply chains that had nothing to do with energy.
Week Three: March 14 to March 20. The Policy Shock

Four central banks froze rate decisions in 48 hours. The Bank of England, the ECB, the Bank of Japan, and the Swiss National Bank all held rates steady, abandoning what had been a coordinated global easing cycle. The easing cycle did not survive the third week of war. CME FedWatch repriced from a 6 percent probability of a Fed hike to 52 percent. The entire rate path for 2026 was rewritten in a single week.
The DXY topped 100 as every other major currency weakened against the dollar. The yen lost its safe-haven status because Japan, an energy importer dependent on Middle Eastern LNG, was now on the wrong side of the supply disruption. Japan had three weeks of gas left at current consumption rates.
Gold crashed 7 percent in a single day, marking the worst week since 1983. The war did not end. The cash did. Institutional portfolios facing margin calls on energy positions sold the most liquid asset available. Gold went from safe haven to liquidity source overnight. Gold, silver, and platinum were all flashing the same signal: this was not a rotation but a forced liquidation.
The S&P 500 hit its 2026 low, though the equal-weight version was up 3 percent, revealing that the sell-off was concentrated in tech and rate-sensitive sectors rather than reflecting broad economic weakness. The S&P 500 posted its worst session of the year on the same day Bitcoin hit a weekly high, one of the few moments during the conflict when crypto decoupled from equities.
The Trump administration lifted sanctions on 140 million barrels of Iranian oil at sea while simultaneously bombing Iran, a contradiction that captured the incoherence of a policy that needed lower oil prices without ending the war that caused them to rise. US gasoline posted its biggest weekly jump since Russia invaded Ukraine, and diesel was worse. Japan’s market lost 3.4 percent in a single Thursday session, with the Bank of Japan blaming a war it has no power to stop.
Every Gulf equity market crashed, but the Tadawul fought back because Aramco’s revenue from elevated crude prices offset the damage to the rest of the Saudi economy. The divergence between Gulf markets that produce oil and Gulf markets that consume it became the clearest illustration of how the war was reshaping regional capital flows. Vietnam had 20 days of fuel left and the Philippines sourced 96 percent of its oil from the Gulf. The strait was shut and the ASEAN supply chain had no alternative.
Week Four: March 21 to March 27. The Institutional Escalation

The conflict shifted from market shock to institutional response. Asia stopped debating oil prices and started rationing fuel. Bangladesh stationed troops at oil depots. The Philippines cut the government work week to four days. Thailand ordered state agencies to work from home. Nepal began rationing cooking gas. India invoked emergency powers to redirect LPG from industrial users to households.
Japan asked the IEA for more oil. Prime Minister Takaichi met IEA Executive Director Birol in Tokyo and requested preparations for a second coordinated release. The first 400 million barrels lasted three weeks. Birol confirmed 80 percent of IEA member stocks remained, but reserves are a buffer, not a supply source. Forty-five Japanese ships remained stranded in the Gulf.
Iran turned the Strait of Hormuz into a toll road, charging commercial vessels up to $2 million per voyage on an ad hoc basis. There was no published tariff, no legal basis under UNCLOS, and no enforcement mechanism beyond the implicit threat of interdiction. Iran was no longer just closing the strait. It was monetising it.
ADNOC could not ship its own gas. Goldman Sachs projected that Gulf GDP could drop 14 percent if the conflict persisted through April. UAE production was down more than 50 percent. Dubai hotel bookings had fallen 60 percent. Jebel Ali port, which accounts for 36 percent of Dubai’s GDP, suspended operations.
Apollo told private credit investors they could have 45 cents on the dollar. The firm’s $14.5 billion BDC received $1.5 billion in redemption requests and capped payouts at $730 million. Blackstone, Blue Owl, BlackRock, and Morgan Stanley collectively faced over $10 billion in Q1 redemption requests across the sector. Private credit had spent five years selling itself as the asset class that did not correlate with public markets. That pitch broke when the war rewrote the rate path, the rate path changed the credit outlook for floating-rate borrowers, and investors who were promised quarterly liquidity discovered the exit door only opened for less than half the queue.
Korean stocks lost 20 percent in two days and Bitcoin picked up the check, in one of the more striking cross-asset moves of the conflict. South Korean retail investors, locked out of a cratering Kospi by trading halts, rotated directly into crypto, pushing Bitcoin volume on Upbit above $159 million per day and temporarily exceeding the exchange’s equity trading volume. The pattern repeated across Asia: when traditional markets froze, digital assets absorbed the flow not because they were safe but because they were open.
The Commodity Shock Beyond Oil
The conflict’s most underreported dimension is its impact on commodities that have nothing to do with crude. The price that will determine whether 45 million more people go hungry is printed on a bag of urea, not on a barrel of oil. Roughly 30 percent of internationally traded fertiliser transits the Strait of Hormuz. Unlike oil, there are no strategic reserves. The FAO estimates 3 to 4 million tonnes of fertiliser trade has been stalled per month. FOB granular urea in Egypt jumped from $490 to roughly $700 per metric tonne. It is spring planting season across the Northern Hemisphere. The fertiliser is not arriving.
Fertiliser plants in India, Bangladesh, and Pakistan stopped production as natural gas feedstock costs exceeded operating margins. Two vessels carrying 80,000 tonnes of Thai rice bound for Iraq were stopped at a Bangkok port. India’s agricultural exports to Gulf countries, including bananas and rice, were cut dramatically. The same strait that blocks fertiliser going out blocks food going in. The World Food Programme warned that 45 million additional people could be forced into acute food insecurity in 2026 if the conflict continues. The countries most exposed, Sudan, Bangladesh, and several sub-Saharan African economies, source more than half their fertiliser from the Gulf and have the least fiscal capacity to absorb the price shock.
Helium supply was cut by roughly a third when Qatar’s Ras Laffan went offline. Semiconductor fabs across Asia reported two to four weeks of helium inventory before fabrication lines would need to slow or stop. Spot helium prices doubled. The chip shortage of 2021-2022, driven by demand, could be followed by a shortage driven by the loss of a single noble gas from a single facility in a single country at war.
The Currency and Rate Repricing
The war split global currencies into three categories: energy exporters, energy importers, and the dollar. The dollar was not strong. It was the last man standing. The Canadian dollar strengthened because Canada is a net energy exporter. The Mexican peso held because of its 325 basis point carry spread. The Brazilian real waited for October’s presidential election. All three were Americas FX, but they had zero overlap underneath.
The EUR/USD was caught between two forces that never usually move together: a European energy crisis that weakened the euro and a US fiscal expansion that should have weakened the dollar. Eurozone industrial output fell for the second straight month before the energy shock had fully landed. Europe had cut off Russian gas just in time for Hormuz to close. Germany borrowed 174 billion euros in a single year to rebuild its industrial base, and the factories had just started responding when the energy supply disappeared again.
US CPI held at 2.4 percent in February but that print predated the energy shock. ISM prices printed 70.5, the highest input cost reading in years, confirming that the supply-side inflationary impulse was already transmitting through the manufacturing sector. The Fed held rates at 3.50 to 3.75 percent with one dissent calling for a cut, but the market priced the opposite direction. The labour market was weakening before the war, and the war made cutting into it impossible.
The Digital Asset Dimension
The war tested every narrative crypto markets had built over the previous five years. Bitcoin was supposed to be a hedge against geopolitical instability. For the first two weeks, it was not. BTC fell in lockstep with equities, from above $87,000 at the start of the year to below $65,000 in the opening week. Bitcoin’s weekly RSI hit an all-time low and the liquidation engine accelerated as leveraged positions were unwound across exchanges.
But the picture was more complex than a simple risk-off trade. Bitcoin bounced to $69,000 as ETFs snapped their losing streak and Iran’s domestic crypto infrastructure became a de facto capital flight channel. Bitcoin ETFs recorded $2.5 billion in March inflows, nearly recovering all 2026 losses. The institutional bid was returning even as retail sentiment sat at extreme fear. Strategy (formerly MicroStrategy) held 761,000 BTC and continued buying through the volatility.
The regulatory environment shifted dramatically in parallel. The SEC and CFTC issued a joint 68-page interpretation classifying most crypto tokens as non-securities and handing primary oversight to the CFTC. Coinbase moved to acquire Bybit, consolidating exchange infrastructure during a crisis when smaller platforms were struggling with liquidity. An eye drop company bought 8.78 percent of the Sky protocol and renamed itself Stablecoin Development Corporation, applying the MicroStrategy treasury playbook to DeFi governance tokens. Pakistan gave 40 million crypto users a legal framework, targeting $38 billion in remittances. A central bank committed $350 million to crypto from its actual reserves, not seized coins. The war accelerated institutional crypto adoption, though not in the way anyone predicted. Bitcoin did not become a safe haven. Instead, the traditional financial infrastructure broke down far enough that digital alternatives stopped being speculative and started being necessary.
Where This Stands Now

Four weeks into the conflict, there is no ceasefire. Trump issued a 48-hour ultimatum for Iran to reopen Hormuz, then suspended it for five days, claiming productive talks were underway. Iran denied any negotiations. A CNN source later confirmed there had been “outreach” and that Iran was willing to listen to “sustainable” proposals. The five-day suspension expires on Saturday, March 29.
Brent is trading around $104. Citi warned that $200 oil is possible if the conflict extends through June. S&P Global’s alternative scenario, in which Hormuz remains closed through April and Brent averages $200 in Q2, would tip Japan, Germany, and the UK into recession. The Asian Development Bank is mobilising financial support. The Boao Forum’s 2026 projection of 4.5 percent Asian growth was finalised before the war began. India’s flash PMI hit a three-year low. Malaysia held two emergency economic meetings in two days.
The war has exposed a dependency structure that markets had priced as background risk for decades. Twenty percent of global seaborne oil, 30 percent of traded fertiliser, 30 percent of helium, and the majority of Gulf LNG all transit through a 33-kilometre-wide channel that one country can close and nobody has reopened. Every week the strait stays shut, the consequences compound. Energy shortages become rationing. Rationing pushes up food prices. Food prices destabilise governments. And destabilised governments make the commodity markets that started the whole cycle even harder to predict.
The transmission mechanisms are now visible across every region. UK energy bills fell 1.17 percent but remained 35 percent above pre-war levels. Poland’s prime minister told the country’s biggest company to sacrifice margins in what Warsaw heard as a political intervention in corporate strategy. Orlen surpassed Gazprom in market cap while the rest of the Warsaw exchange had its worst week in years. Fertiliser stocks became the new oil trade as investors recognised that the strait does not just move crude.
The conflict is now in its fourth week with no floor in sight. The US passed a 15-point ceasefire proposal to Iran through Pakistani intermediaries. Iran’s preliminary terms include compensation for war damages, control over the Strait of Hormuz, security guarantees, and unrestricted development of its ballistic missile programme. The distance between these positions is measured in years, not weeks. Markets that were designed to price uncertainty are being asked to price a conflict that has no visible endpoint and no precedent in modern commodity markets. Neither side has proposed terms the other can accept.
This page will be updated as the conflict develops. For real-time coverage, follow our reporting on commodities, macro economics, forex, and crypto markets.